Exit focus mode (Ctrl+Shift+F)

Mobile mode is view-only

  • Image
  • PDF
  • PowerPoint
  • JSON / CSV
  • Share presentation
  • Start presentation ⌃⇧f5
  • Delete all waypoints
  • text_fields Rename waypoint
  • format_shapes Edit waypoint
  • delete Delete waypoint
  • Hide all
  • Perspective notes
  • Popped out
  • In card
  • Touchpad navigation
    Scroll to move / pinch to zoom
  • Mouse navigation
    Drag to move / mouse wheel to zoom
KT2: Assignment Instructions (Summer 2020)
view only
  • Jamie Schwandt (Dr. Schwandt) avatar
  • text_fields Rename
  • Color
  • Add to map
  • delete Delete perspective
Card Style
insert_photo Media
Add a comment
Attributes
visibility Perspectives
airplay Create Waypoint
Layout
delete Delete card
  • Style
  • Add a card
  • Straighten line
  • Move endpoints
  • delete Delete relationship
Add a comment
Add to the perspective of...
info
  • List layout
  • Column layout
  • Freehand layout

Explain

Add a note about from the perspective of

Learn more…

undefined cards have been added

Expand to view Undo

0 regions selected

Color
edit Rename
Select all in region Duplicate region
delete Delete region
>

Step #2

What - So What - Now What

(S) Systems

Step #1

Step #3: Pyramid Principle

Step #1b

(R) Relationships

(D) Distinctions

Systems Thinking... what is it?

(P) Perspectives

Step #1a

1 collapsed result
Empirical Rule
Empirical Rule
For nearly symmetric mound-shaped data sets, approximately 68% of the data is within one standard deviation of the mean and 95% of the data is within two standard deviations of the mean.
1 collapsed result
The Cartoon Guide to Statistics by Larry Gonick
What makes statistics unique is its ability to quantify uncertainty, to make it precise. This allows statisticians to make categorical statements, with complete assurance-about their level of uncertainty!
Listen when you hear people state, "I'm 95% confident that..."
For example, in 1886, the space shuttle challenger exploded, killing seven astronauts. The decision to launch in 29-degree weather had been made without doing a simple analysis of performance data at low temperature.
Statisticians rely on three related disciplines:  1) Data analysis (gather, display, and summary of data); 2) Probability (the laws of change... gambling); 3) Statistical Inference (science of drawing statistical conclusions from specific data, using a knowledge of probability)
1 collapsed result
Data
Data
are the statistician's raw material, the numbers we use to interpret reality. All statistical problems involve either the collections, description, and analysis of data, or Thinking about the collection, description, and analysis of data.
Data Description
Data Description
how can we represent data in useful ways; how can we see underlying patterns in a heap of naked numbers; how can we summarize the data's basic shape
1 collapsed result
For example:
For example:
Frequency Table - we are showing how many data points are AROUND each value
Histogram - we can graph a frequency where each bar covers an interval and is centered at the midpoint. The bar's height is the number of data points in the interval.
Why statistics? Why it is simple to understand...
1 collapsed result
Zoom in
Zoom in
all that complexity must be coming out of really simple rules
Systems Thinking improves how we think
1 collapsed result
Zoom out
Zoom out
CAS emerge from simple rules. That underlying complexity, there is simplicity.
So, what do we mean then that our systemic thinking is both complex and simple? It means that the process of systems thinking is based on simple rules despite the fact that the outcomes may be terribly complex.
1 collapsed result
Systems Thinking as described in Super Thinking: The Big Book of Mental Models
Systems thinking describes the act, when you attempt to think about the entire system at once. 
By thinking about the overall system, you are more likely to understand and account for subtle interactions between components that could otherwise lead to unintended consequences from our decisions.
For example, when thinking about making an investment, you might start to appreciate how seemingly unrelated parts of the economy might affect its outcome.
1 collapsed result
Assignment Rules
Assignment Rules
1 collapsed result
Rules (Instructions)
Rule 1. Watch and review this presentation.
KT2 Assignment Instructions and How-To Video
Rule 2. Read Chapters 1-2 of your textbook.
Rule 3. Create a KT using DSRP to explain what the relationship of Standard Deviation and the Normal Curve is.
Starts on p. 18 of your textbook.
Rule 4. Create a Post in the Learning Community and include a link and/or image to your Plectica Map
You must respond to (at a minimum of two) other student post
Rule 5. Take the Feedback Survey (Required) at the following link (and post that you completed it).
1 collapsed result
SMEAC
SMEAC
pronounced "SME - Ak"
Situation
Situation
You reviewed the situation by examining the assignment rules.
Mission
Mission
Complete a KT and post in the class WordPress site (and the Facebook Group for extra credit - don't forget the first to post this in the class WordPress site also receives extra credit).
Execution
Execution
Each student will focus their effort on completing the following simple rules. You will then post to the Swarm Learning (SL) WordPress site and respond to at least two other student posts.
Administration (and Feedback)
Each student must have access to Plectica, the WordPress site (and it is suggested that you are a member of the SL Facebook Group). Student KTs will serve as a feedback mechanism for the instructor.
Communication
Communication
Each individual student is in control of their KT. Your KT must be posted to the WordPress site (and respond to at least two other students) by no later than the end of the current module.
Blockchain understood using DSRP
idea C
idea C
view for perspective 1 and 2
courtroom
courtroom
lawyer
lawyer
hospital
hospital
doctor
doctor
Iran
Iran
UK
UK
or
or
1 collapsed result
Numbers
Numbers
1
1
2
2
3
3
Israel
Israel
USA
USA
1 collapsed result
idea B
idea B
idea B
perspective 2
perspective 2
1 collapsed result
idea A
idea A
idea A
perspective 1
perspective 1
Different perspectives result from changing the point, the view, or both.
D
D
C
C
B
B
A
A
idea
idea
idea
idea
1 collapsed result
Letters
Letters
A
A
B
B
C
C
Political Ecology
Political Ecology
Perspectives Example
1
1
B
B
C
C
2
2
Organizing by Part-Whole
A
A
3
3
Perspectives Rule
Perspectives Rule
Any thing or idea can be the point or the view of a perspective.
Think of an analogy, simile, and metaphor.
For example, you could say....

A is to B as/like C is to D
Relationships Rule
Relationships Rule
Any idea or thing can relate to other things or ideas.
1 collapsed result
DSRP: 4 Patterns and 8 Elements
1 collapsed result
Simple Rule or Pattern
Distinction (D)
Distinction (D)
System (S)
System (S)
Relationship (R)
Relationship (R)
Perspective (P)
Perspective (P)
1 collapsed result
Element 1
Element 1
thing (t)
thing (t)
part (p)
part (p)
action (a)
action (a)
point (p)
point (p)
1 collapsed result
Element 2
Element 2
other (o)
other (o)
whole (w)
whole (w)
reaction (r)
reaction (r)
view (v)
view (v)
Part-Whole Diagram
Part-Whole Diagram
C2
C2
C1
C1
C
C
B1 and B2 as well as C1 and C2 are just parts, but they have the potential to be wholes
B2
B2
B1
B1
B
B
B and C act as parts of A but are also wholes that contain parts
A
A
A is just a whole
1 collapsed result
What is DSRP?
What is DSRP?
Universal cognitive patterns. Four simple rules that can be mixed and matched, combined and recombined in ways that are immensely complex, leading to robust, systemic thinking. Think of the diversity and creativity of nature that produces peacocks, giraffes, and star-nosed moles is born of genetic mutations of the four nucleotides of DNA (ATCG).

Much like the genetic code that underlies all species, DSRP provides a cognitive code that underlies human thinking.
While the simple rules of systems thinking are DSRP, the agents are little bits of information.
Systemic thought emerges from bits of information following simple rules (DSRP)
1 collapsed result
Simple Rules of a Flock
For example, a flock follows three simple rules
maintain distance x (locally to nearest neighbors)
Rule #1
adjust direction (locally to nearest neighbors)
Rule #2
avoid predators
avoid predators
Rule #3
Systems Rule
Systems Rule
Any idea or thing can be split into parts or lumped into a whole.
Now What?
Now What?
When we take a CAS perspective on systems thinking, we ask ourselves: what are its simple underlying rules? The simple rules are based on Distinctions (D), systems (S), relationships (R), and perspectives (P). That is, each bit of information can distinguish itself from other bits, each bit can contain other bits or be part of a larger bit, each bit can relate to other bits of information, and each bit of information can be looked at from the perspective of another bit of information and can also be a perspective of any other bit.
So What?
So What?
The cognitive patterns within DSRP are not merely applicable to systems thinking, they are universal to all thoguht.
What?
What?
DSRP provides us simple rules to help us understand complex systems.
Gist
Gist
Four simple rules produce collective dynamics that in turn emerge as systemic thought.
1 collapsed result
2. Complex Adaptive Systems (CAS)
What are the basic features of a CAS?
1. autonomous agents following simple rules
2. the collective dynamics of which lead to
3. emergent complexity (e.g. intelligence, self-organization, robustness, resiliency, adaptive behavior)
A great example of a CAS is the flocking behavior in animals (i.e. flock of birds, flock of sheep) and other superorganisms, such as an ant colony and a school of fish.
There are no leaders providing direction... so what are they following?
They follow simple rules that bring about remarkable, adaptive, and complex behaviors.
1 collapsed result
1. Mental Models
1. Mental Models
mental model
mental model
real world
real world
describes, summarizes, predicts, and leads to behavior in
consequences of which inform adaptation; selective effect on viability and on competition among models
Examining STv1.0 and STv2.0 through ST Questions
1 collapsed result
v1.0
v1.0
What are systems?
What are systems?
How do systems work?
Are there universal elements to systems behavior across different types of systems?
What are the fundamental elements of a system?
What are the simple rules of complex systems?
Source: Systems Thinking Made Simple: New Hope for Solving Wicked Problems
1 collapsed result
Systems Thinking is a Complex Emergent Property of Four Simple Rules
1 collapsed result
To understand Systems Thinking v2.0, we must first understand two key ideas:
1. The idea of Mental Models
mental models approximate the real world, which provides feedback to adapt our mental models
2. The concept of a Complex Adaptive System (CAS)
a system that adapts to become better suited to its environment
1 collapsed result
v2.0
v2.0
What is systems thinking?
How does systems thinking work?
Are there universal elements to systems thinking regardless of approach?
What are the fundamental elements of systems thinking?
What are the simple rules of systems thinking?
Thinkquiry example
Thinkquiry example
1 collapsed result
DSRP is Systems Thinking v2.0
We can first compare it to Systems Thinking v1.0
Distinctions Rule
Distinctions Rule
Any idea or thing can be distinguished from the other ideas or things it is with.
Guiding Question
Guiding Question
What is DSRP?
Relationships (R)
Relationships (R)
How are they related?
Systems (S)
Systems (S)
What are its parts?
Distinction (D)
Distinction (D)
What is Statistics?
Tableau example of  Standard Deviation
1 collapsed result
SCQ Framework
SCQ Framework
1. Subject
1. Subject
Standard deviation of measured dogs
2. Question
2. Question
How do you determine it?
3. Answer
3. Answer
Find the mean, find the difference from the mean (and each number), square the result, find the mean of the squared differences, then find the square root.
4. Situation
4. Situation
Find the standard deviation of the measured dogs.
1 collapsed result
5. Complication
5. Complication
Don't know how to determine the standard deviation.
Question
Question
Use the answer (3) above
Answer
Answer
147mm
6. New Question
6. New Question
Why is the standard deviation of 147mm important?
7. Key Line
7. Key Line
Now we can show which heights are within 1 standard deviation (147mm) of the mean. So, using the standard deviation we have a "standard" way of knowing what is normal, and what is extra large or extra small.
Tip
Tip
Use this framework when creating your blog post
1 collapsed result
Bubble Logic for Two-Column Proofs
1 collapsed result
Statements
Statements
conclusions
1) The heights (at the shoulders) are: 600mm, 470mm, 170mm, 430mm and 300mm.
2) The mean (average) height is 394 mm
3) The difference from the mean for each dog is 206, 76, -224, 36, -94
4) The variance is 21,704
1 collapsed result
5) The standard deviation is 147mm
And the good thing about the standard deviation is that it is useful. Now we can show which heights are within 1 standard deviation (147mm) of the mean. So, using the standard deviation we have a "standard" way of knowing what is normal, and what is extra large or extra small.
We can expect about 68% of values to be within +/- 1 standard deviation
1 collapsed result
Reasons
Reasons
If: statement above
Then: statement same line
1) Given
1) Given
1 collapsed result
2) If you need to find the standard deviation of a set of numbers,
Then you must first find the mean
1 collapsed result
3) If the mean has been calculated,
Then we must calculate each dog's difference from the mean
600-394 = 206; 470-394 =76; 170-394 = -224; 430-394 = 36; 300-394 = -94
1 collapsed result
4) If the difference from the mean for each dog has been calculated,
Then we must calculate the variance by taking each difference, squaring it, and calculating the average result
1 collapsed result
5) If the variance has been calculated,
Then you must find the standard deviation, which is the square root of the variance
Given
Given
The heights (at the shoulders) are: 600mm, 470mm, 170mm, 430mm and 300mm.
Find
Find
The standard deviation of the heights of your dogs in millimeters.
1 collapsed result
Plectica Concept Map Rules
Guiding Question
Guiding Question
What is statistics, measurement, evaluation, and assessment. And what is the standard deviation of test scores provided in this example?
1 collapsed result
Given Information/Data
Use example provided
1 collapsed result
Standard deviation
Standard deviation
is a measure of how spread out numbers are from the average of a data set. It is not the same as average or mean deviation or absolute deviation, where the absolute value of each distance from the mean is used - is the measure most frequently used in statistical analysis
Its symbol is σ (the greek letter sigma)
1 collapsed result
Guided Question
Guided Question
You and your friends have just measured the heights of your dogs (in millimeters). Find the mean, the variance, and the standard deviation.
Given Information/Data
The heights (at the shoulders) are: 600mm, 470mm, 170mm, 430mm and 300mm.
1 collapsed result
Rules and Logic (Bubble Logic)
To solve standard deviation:
1. Find the mean
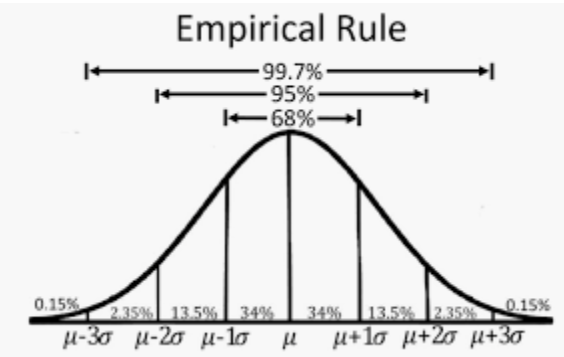
2. Then for each number: subtract the mean and square the result
3. Then find the mean of those squared differences
4. Take the square root of that and you have the standard deviation
Assessment
Assessment
The process of measure, evaluate, identify, and prescribe.
Evaluation
Evaluation
judgement about the measurement - for a measurement to be effective, it must be followed by evaluation
Test
Test
is an instrument or a tool used to make a particular measurement
1 collapsed result
Propositions about a population
statistical inference makes propositions about a population, using data drawn from the population with some form of sampling
Hypothesis testing
Hypothesis testing
given a hypothesis about a population, for which we wish to draw inferences, statistical inference consists of (first) selecting a statistical model of the process that generates the data and (second) deducing propositions from a model
1 collapsed result
Measurement
Measurement
is the assignment of a number to a characteristic of an object or event, which can be compared with other objects or events
or the process of assigning a number to a performance or an attribute of a person
Probability theory
Probability theory
deals with the analysis of random phenomena
1 collapsed result
Dispersion (or variability)
characterizes the extent to which members of the distribution depart from its center and each other
1 collapsed result
variance, standard deviation, range
Grade point average (gpa) example
this single number describes the general performance of a student across the "range" of their course experiences
1 collapsed result
Central tendency (or location)
seeks to characterize the distribution's central or typical value
mean, median, and mode
Distribution (sample or population)
Index (statistics)
Index (statistics)
compound measure in statistics - a measure of changes in a representative group of individual data points, or in other words, a compound measure that aggregates multiple indicators. Indexes summarize and rank specific observations.
Inferential statistics
draw conclusions from data that are subject to random variation (e.g. observational errors, sampling variation).
Descriptive statistics
summarize data from a sample using indexes such as mean or standard deviation
1 collapsed result
Statistics
Statistics
study of the collection, organization, analysis, interpretation, and presentation of data
two main statistical methods used in data analysis
is to
is to
like
like
is to
is to
tension
tension
tension
tension
tension
tension
neutral
neutral
allies
allies
allies
allies
is to
is to
like
like
is to
is to
relates to
relates to
difference
difference
one measures the dispersion
or how far apart the data is
one measures the center
or where the values tend to be centered
using the results of measurement and evaluation to identify performance and behavior problems and to prescribe how the problems can be corrected is an
to have meaning, you interpret test scores
this interpretation of measurement is an evaluation
inferences on mathematical statistics are made under the framework of
concerned with two sets of a distribution
feedback on
feedback on
approximation of
approximation of
descriptive statistics aims to summarize a sample, rather than use the data to learn about the population that the sample of data is thought to represent

Position and resize the waypoint to include the content you want to present.

Edit attribute
Remove attribute